
Which areas in North America see the largest increase and decrease in population?

Like this map and want to support Landgeist? The best way to support Landgeist, is by sharing this map. When you share this map, make sure that you credit Landgeist and link to the source article. If you share it on Instagram, just tag @Land_geist. On X / Twitter tag @Landgeist.
We’ve already looked at the annual population change for US counties. But this time, I want to look, not just at the US, but at all of North America.
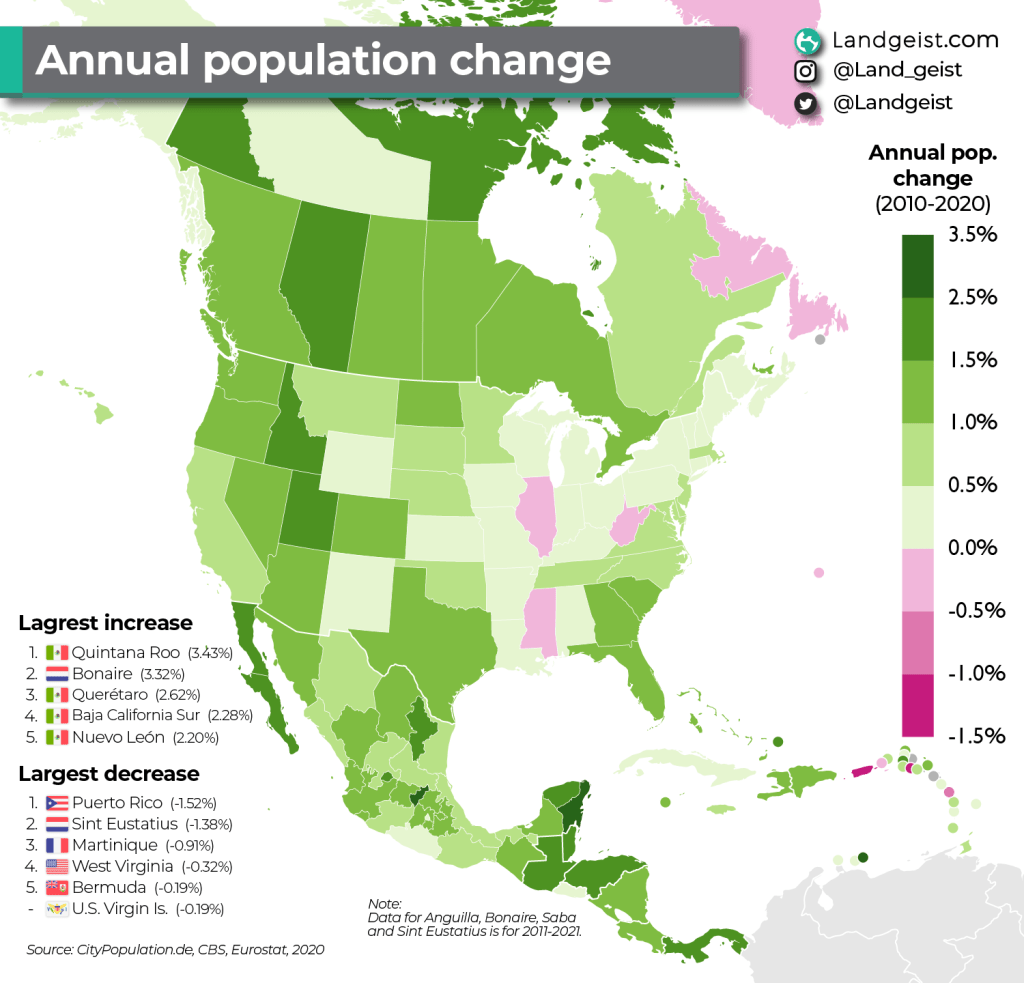
The numbers on this map represent the average annual population change. This number was calculated by using the population data from the 2010 and 2020 Census. Overall, North America looks pretty green. We’ve seen before that both Europe and East Asia have quite a few countries and regions where the population is decreasing. In North America, there are only two places where the population is decreasing by more than 1% per year. A big contrast with places like Daxing’anling prefecture in China (-4.3%) or Gjirokastër in Albania (-3.0%), which are the fastest decreasing areas in East Asia and Europe respectively.
Most of the fastest growing areas are located in Mexico. Quintana Roo in central Mexico grew faster than any other region in North America (3.43%). The Dutch island of Bonaire (3.32%) is the only other area in North America that saw an annual growth of over 3%. Other places with a decent annual population growth in North America are countries like Belize, Guatemala, Honduras, Panama, the US states of Montana and Utah and the Canadian provinces of Alberta, Nunavut and Yukon.
Puerto Rico (-1.52%) and the Dutch island of Sint Eustatius (-1.38%) are clearly the two places in North America with the largest decreasing population. The US state of West Virginia (-0.2% also made it into the top 5.


Leave a comment