
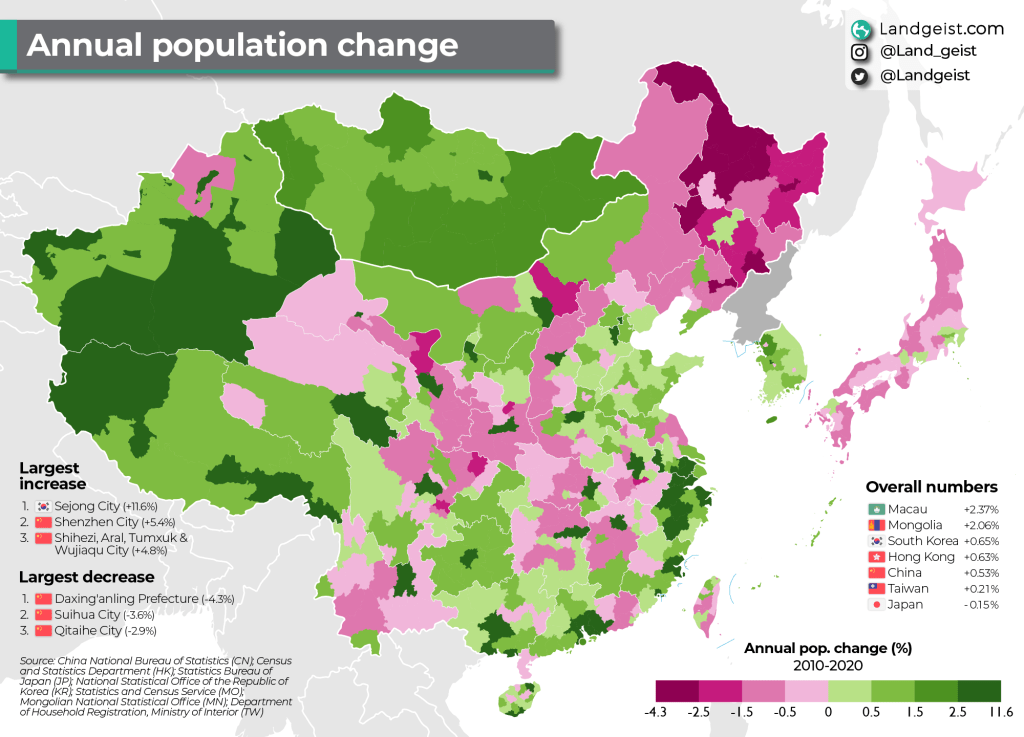
Which areas in East Asia see the largest increase and decrease in population?

Like this map and want to support Landgeist? The best way to support Landgeist, is by sharing this map. When you share this map, make sure that you credit Landgeist and link to the source article. If you share it on Instagram, just tag @Land_geist. On X / Twitter tag @Landgeist.
We’ve already looked at the annual population change in Europe and the US. On this map, we’re going to look at East Asia. The data is shown for each country’s first level administrative divisions, with the exception of China, where it shows the data at the second level administrative divisions. China’s provinces are larger in size (both area and population) than many countries. Therefore, I think it’s better to show the data for China at the second level administrative divisions. The white lines within China show the provincial borders.
Japan is the only country on this map that reported a decrease in overall population. On this map, we can see that most areas in Japan experience a decrease in population size. With the exception of the Tokyo metro area, Nagoya, Shiga prefecture, Fukuoka and the Ryukyu Islands.
Taiwan experienced a slight population growth. Major cities like Taipei, Taichung, Tainan and Kaohsiung still see their population grow.
In South Korea we see the opposite pattern. Most of the country reports a population growth, but it is major cities like Seoul, Busan, Daejon and Daegu where the population decreased.
Mongolia is the only country in East Asia where the population increased in every region. Especially in its capital Ulaanbaatar.
In this article I want to look a bit deeper into China’s numbers, also because it’s a country that personally fascinates me. China’s numbers might look nothing out of the ordinary, as they are quite similar to Taiwan and South Korea. There is however one big important difference. South Korea, Taiwan, Japan and even Hong Kong are developed countries with a much higher GDP per capita than China. China is in fact still a developing country. Although the standard of living in big cities like Shanghai and Shenzhen is very similar to developed countries, China’s tier 1 cities are not representative of the whole country.
A low population growth is not uncommon for a developed country. But a developing country needs a decent population growth until it becomes a developed country. Otherwise their hopes and dreams of becoming a developed country can come to a halt.
Just before China released their 2020 census numbers, many experts were expecting the Chinese population to have decreased or close to decreasing. The final numbers showed that China’s population grew slightly. Despite this small growth, China’s total population is expected to peak soon. Many experts believe China might be overestimating the numbers and there is good reason to believe this. Statistics from China are often unreliable and very opaque to start with. Even premier Li Keqiang admitted this. Local governments are incentivised to overstate the population numbers, as government funding partially depends on it. Furthermore, the central government is very sensitive to face and finds it very important to appear well to the Chinese public and the outside world.
Probably the 2 most important factors that have slowed China’s population growth are the 1-child policy and the rapid economic growth. People tend to have less kids as their economic situation improves. Although in China, this was already limited to one child for most people. However, for many young Chinese, it is now too expensive to have even one child, even though the 1-child policy has been relaxed to a 3-child policy. Especially in the big cities, life has become almost unaffordable for many young Chinese. The cost of living has gone up significantly and the real estate boom/bubble has driven up property prices to the point where it takes more than 40 annual family salaries to afford a median sized apartment. Almost all young Chinese couples are single children. Which means that on top of that, they have to take care of both their parents. Leaving little to no time and money to have kids.
China has been experiencing massive economic growth over the past decades. However, that could come to a grinding halt due to the demographic developments in China. China is a middle-income country now and on its way to become a rich country. However, its worrying demographic development might cause China to grow old before it grows rich. This is the so-called middle-income trap. China’s working age population will shrink in the coming decade, which will negatively affect economic growth. To the point where it could stop China from making the transition to a rich country for the next few decades until its demographic balance is restored. Something similar like Japan experienced from the 90s onward, where the Japanese economy didn’t grow at all for a long time. However, Japan was already a developed country at that point.
We can see that the highest population increases are in some of China’s major cities and in some parts of Tibet and Xinjiang. This could be a sign that most of the population growth in these major cities is from people from the surrounding areas moving into the bigger city. The fact that many of these cities are surrounded by pink areas, makes this a plausible explanation.
The biggest decreases are clearly in China’s north east, in China’s own Rust Belt. This covers the provinces of Heilongjiang, Liaoning and Jilin. This area once had a strong industrial sector and experienced strong economic growth. But those days are over for the north-east of China. China is also the only country in East Asia that has areas that experienced an annual population decrease that’s over 1.5%.
Data for this map was gathered through City Population and also individual sources of each country’s census or bureau of statistics. The annual population change is based on the 2010 and 2020 census data. It was calculated using this formula: ((f/s)1/y-1)*100, where f is the 2020 number and s the 2010 number and y the no. of years (10).


Leave a comment