
How many years will European children spend on average in the education system?

Like this map and want to support Landgeist? The best way to support Landgeist, is by sharing this map. When you share this map, make sure that you credit Landgeist and link to the source article. If you share it on Instagram, just tag @Land_geist. On X / Twitter tag @Landgeist.
A while ago, we looked at how long Europeans are in the education system on average. That map showed the average number of years that people over 25 have spend in the education system. As it included a very broad demographic group, it showed quite some differences with the amount of time children spend in the education system today. Both datasets sound similar, but show a very different type of information. As they’re both very interesting topics, I’ decided to make a map about the expected years of schooling as well.
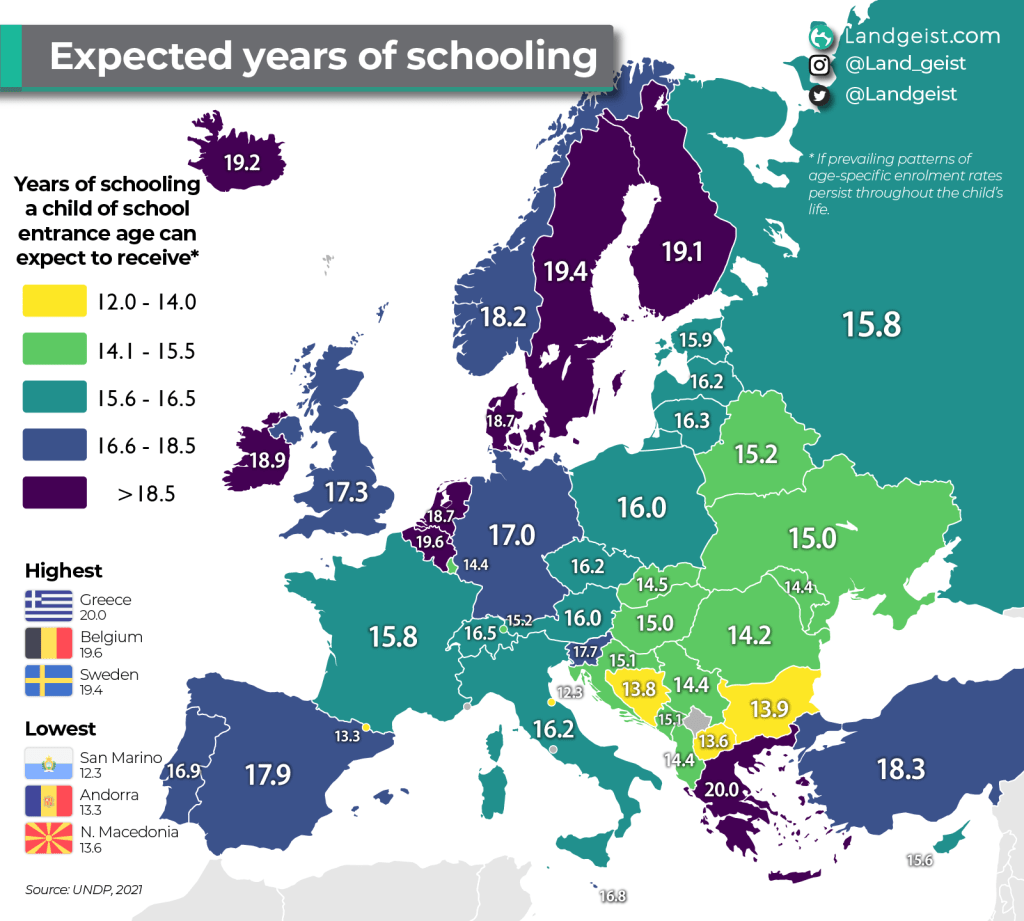
We can see there is a pretty clear divide between the Eastern Europe and the rest of Europe. In most of Eastern Europe, the expected years of schooling is 15 years or less. Keep in mind though, that this doesn’t necessarily say something about the quality of the education.
Greece has the highest expected years of schooling, 20 years. Belgium (19.6), Sweden (19.4), Iceland (19.2) and Finland (19.1) are the only other European countries with a number of 19 years or higher. In most of the other European countries, the expected years of schooling is between 16 and 19 years.
The lowest numbers can be found in San Marino (12.3), Andorra (13.3) and Northern Macedonia (13.6).
Data for this map comes from the UNDP.


Leave a comment