
How many lightweight plastic bags do Europeans use every year?

Like this map and want to support Landgeist? The best way to support Landgeist, is by sharing this map. When you share this map, make sure that you credit Landgeist and link to the source article. If you share it on Instagram, just tag @Land_geist. On X / Twitter tag @Landgeist.
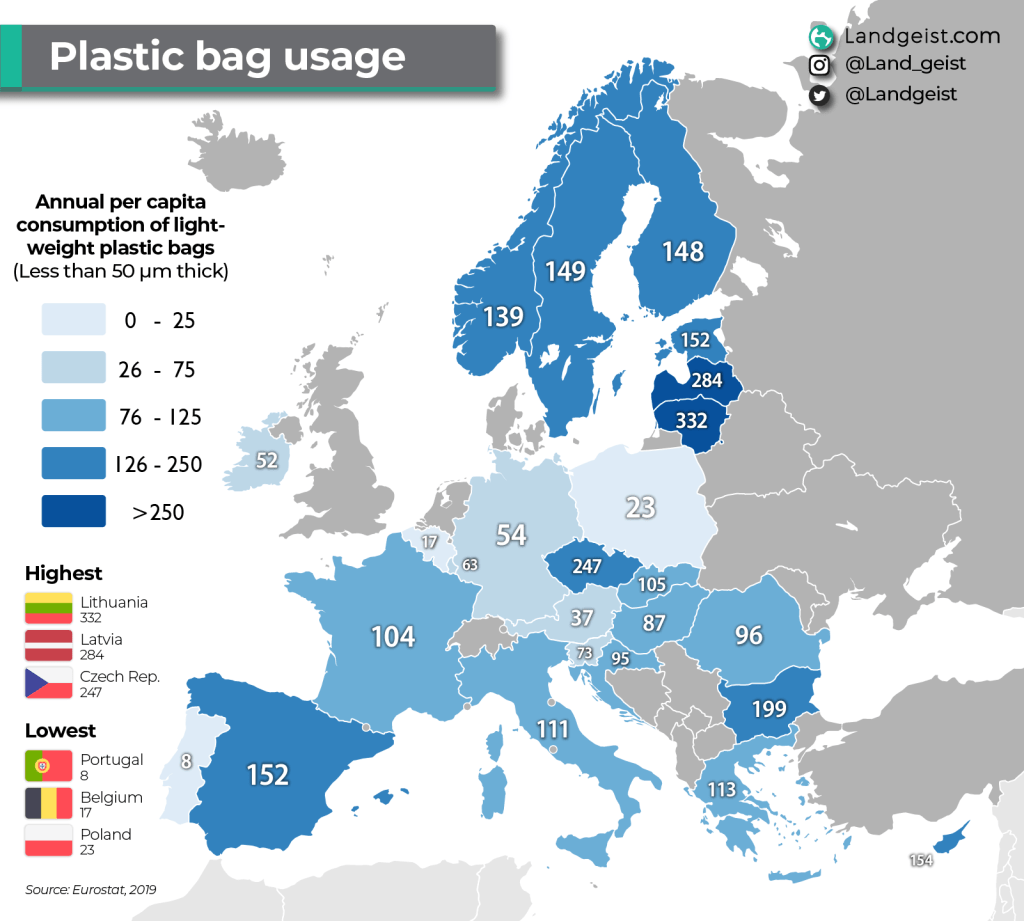
To reduce pollution of plastics and micro-plastics, more and more countries start to encourage or even create legislation to reduce the use of lightweight plastic bags. This map shows us the annual consumption of all lightweight carrier bags made of plastic, that are supplied to customers at the point of sale of goods or products, with a wall thickness of less than 50 microns.
Interestingly, the Baltic and Nordic countries have the highest consumption of lightweight plastic bags. Latvia (284) and Lithuania (332) consume far more plastic bags than any other European country.
The lowest usage can be found in Portugal (8), Belgium (17) and Poland (23). The consumption of lightweight plastic bags has only been documented since 2018. So we can’t look at any trends yet. However, compared to 2018, most European countries reduced their plastic bag usage.
Data for this map comes from Eurostat.


Leave a comment