
Which cities in Europe have the worst traffic?

Like this map and want to support Landgeist? The best way to support Landgeist, is by sharing this map. When you share this map, make sure that you credit Landgeist and link to the source article. If you share it on Instagram, just tag @Land_geist. On X / Twitter tag @Landgeist.
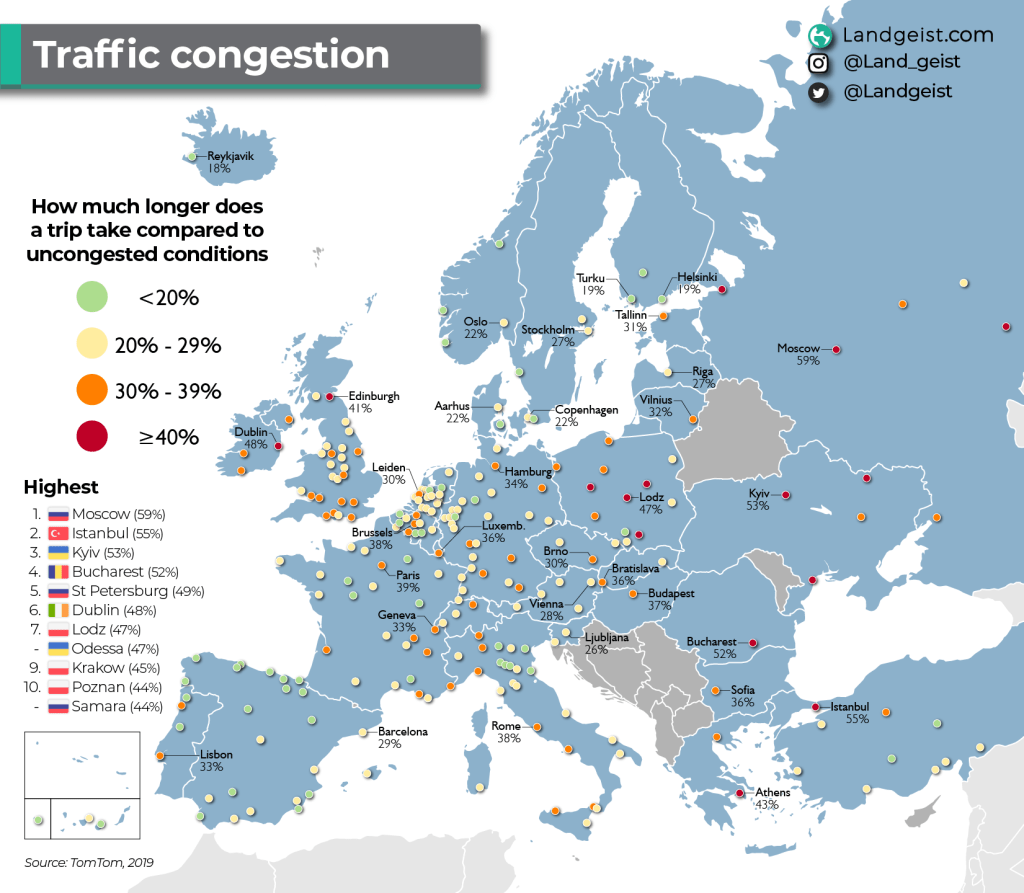
One of the worst parts of travelling to work, is the traffic. For those of you that work in a big city and don’t use public transport, you are probably all too familiar with how bad traffic can be. This map shows you how congested European cities are. It is measured by how much longer a trip takes compared to uncongested conditions.
The most congested city in Europe is Moscow. Which also ranks 6th worldwide. It might not be too surprising, as Moscow is infamous for its traffic jams. An average trip will take 59% longer in Moscow. Meaning that a 45-minute commute in uncongested conditions will take you almost one hour and 15 minutes in Moscow. Second is Istanbul, which also makes it into the global top 10 at no. 9.
Moscow is not the only Russian city in the European top 10. St Petersburg (49%) and Samara (44%) also make it into the top 10. Poland is also quite well represented in the top 10, with 3 cities. Dublin (48%) is the only city in the western half of Europe that makes it into the top 10.
We can see some interesting differences between countries as well. First off, the Nordic countries look quite green. The low population density is definitely an important factor here. Spain is also looking fairly good, with a lot of green and some yellow here and there. The Netherlands also doesn’t look too bad, with only yellow and green cities. Although there are quite a number of yellow cities.
Ireland, Poland, Russia, Ukraine and the UK are not looking very good. Most of the cities are orange or even red.
In the 2019 Traffic Index, TomTom has ranked more than 400 cities worldwide by how congested the traffic in that city is. Although more recent data is available, I have decided to use 2019 data. Since many people in some countries have been working at home for a significant time in 2020 due to Covid-19, it would be more realistic and fairer to show a pre-Covid picture, when things were more normal.
However, I would be very curious to have a look at this map a few years from now and compare the situation again. If working from home becomes more normal after the pandemic is over, then it would be interesting to see the effect on the traffic situation across Europe.


Leave a comment