
Where in Europe are you most likely to get robbed?

Like this map and want to support Landgeist? The best way to support Landgeist, is by sharing this map. When you share this map, make sure that you credit Landgeist and link to the source article. If you share it on Instagram, just tag @Land_geist. On X / Twitter tag @Landgeist.
I while back I made a map about the robbery rate in Europe. It’s probably one of my most popular maps, especially after famous YouTuber Bald & Bankrupt shared my map.
Recently, I bumped into a similar dataset from Eurostat, but one that showed the robbery rate at the NUTS 3 level. A much heard comment on the previous map, is that the robberies in a lot of countries are concentrated in a small number of areas and cities. This new map gives a much better break-down of where you’re actually more at risk from being robbed.
In late 2023 I made a map based of that Eurostat dataset at the NUTS 3 level. However, there was no regional data available for both the UK and France. As both France and the UK have some of the highest robbery rates in Europe, I thought it was fair to include them with data on the national level.
Still, that didn’t sit completely right with me, so a few months later I looked again for regional for the UK and France. By that time, Eurostat updated their dataset with 2022 data and also regional data for France. On top of that, I found data for the UK on the regional level as well. The result is a much better map that has regional data for the reported robbery rate of almost every European country.
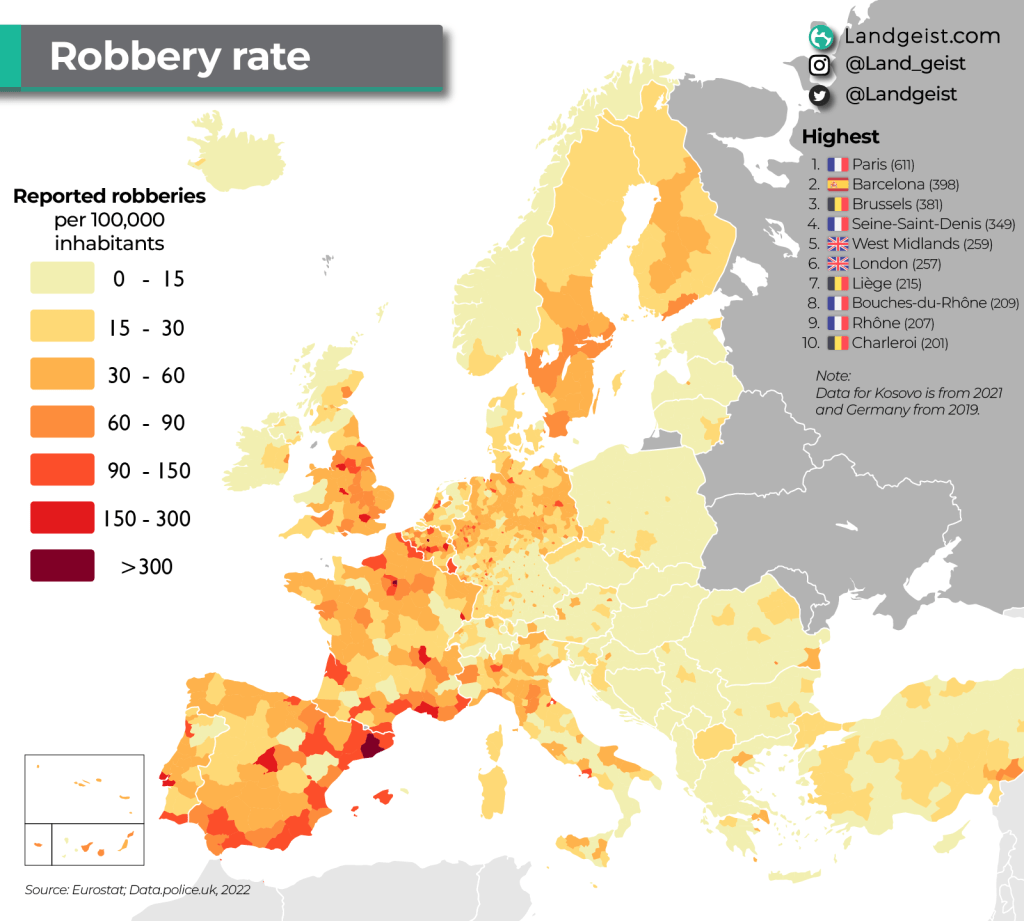
The first map is from 2019, this one has data from 2022 for most countries. Compared to that map, not much has changed in terms of which countries have the highest robbery rate in Europe. Belgium, Spain and England & Wales still have the highest robbery rates in Europe. Sweden, France, Portugal and Luxembourg are still close behind them. These 7 countries still have a far higher robbery rate than any other European country. The gap between no. 7 Sweden (62) and no. 8 Germany (46), is very big.
Compared to the previous map, it looks like the robbery rate in France has gone up a lot. This is actually not the case. The real reason, is that France has revised its data. When making the previous map, I noticed that the robbery rate in France dropped from over 150 in 2015, to the 40s in the following years. This miraculous drop seemed very suspicious. It now turns out that the robbery rate has been dropping steadily in France from 156 in 2015 to 134 in 2019 and 100 in 2022. But not the 42 in 2019 as they reported previously. I have updated that map as well.
The good news is that, compared to 4 years earlier, the robbery rate has gone down in almost every European country. Especially in Belgium, France and Portugal.
Keep in mind that the Eurostat data is based on police reports from each country. The number of unreported robberies can vary from country to country. This could mean that the real robbery rate might be higher in some areas.
A robbery is defined by Eurostat as a means of stealing from someone by using physical force, weapon or threat, such as mugging or robbery (e.g. bank, shop or van). Robbery is different from theft (without force) and assault (without stealing).


Leave a reply to Robbery Rate In Europe: What Are The Most Dangerous Cities? Cancel reply