
What portion of each state’s homes are actually owned by the person living in it?

Like this map and want to support Landgeist? The best way to support Landgeist, is by sharing this map. When you share this map, make sure that you credit Landgeist and link to the source article. If you share it on Instagram, just tag @Land_geist. On X / Twitter tag @Landgeist.
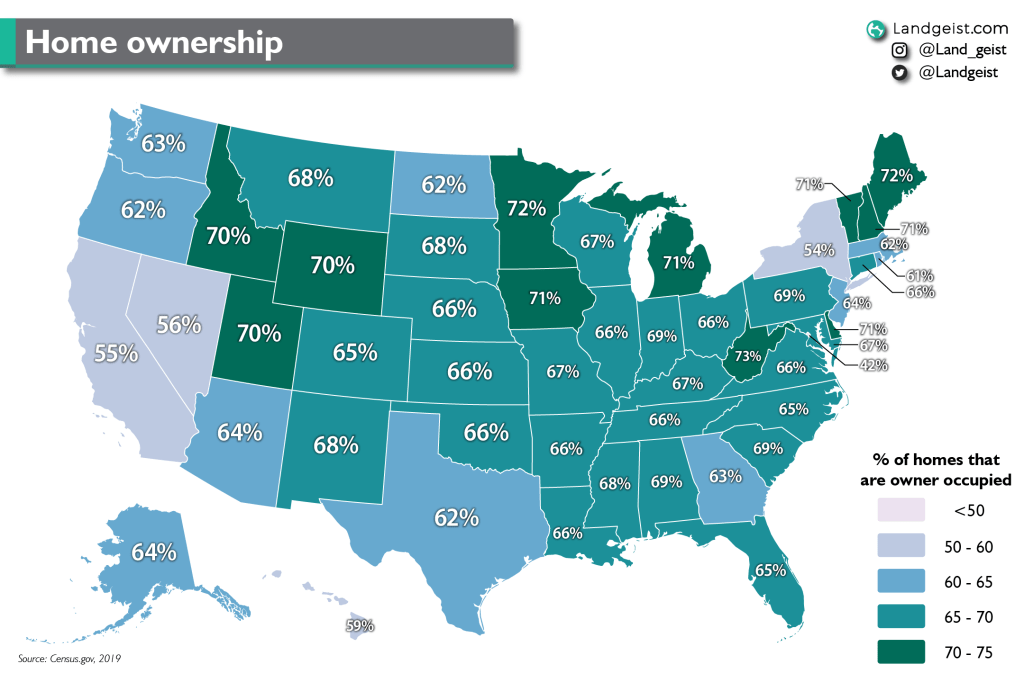
For many people, owning a home is one of their big dreams. On this map we can see how prevalent home ownership is per state. The data looks at all occupied homes and shows what percentage is renter occupied and what percentage is owner occupied. On this map we can see the percentages of occupied homes that are owner occupied.
Home ownership seems to be fairly even throughout most of the US. Ranging from 60 to 70 percent in most states. Home ownership is lowest in D.C., where it’s 42%. New York (54%), California (55%), Nevada (56%) and Hawaii (59%) are the other states that have a home ownership rate below 60%. The highest home ownership rate can be found in West Virginia with 73%. Other states with a home ownership of 70% or higher are Idaho, Utah, Wyoming (70%), Delaware, Illinois, Iowa, New Hampshire, Vermont (71%), Maine and Minnesota (72%).
If you’re curious about the home ownership rate in Europe, check out this map.


Leave a comment