
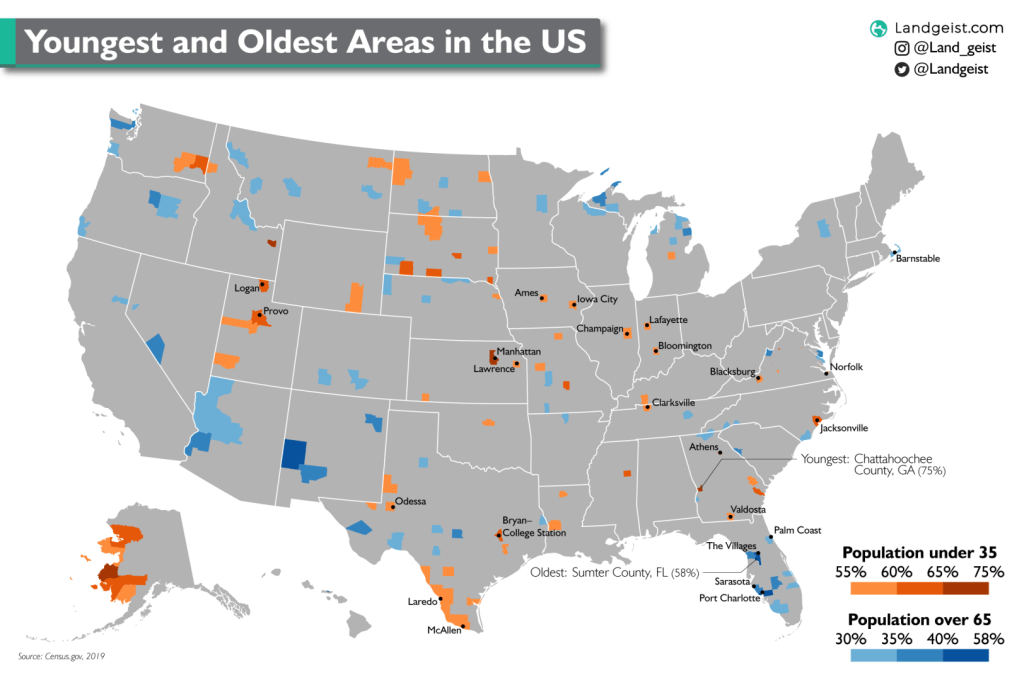
The areas in the US where the share of population aged under 35 or over 65 is the highest.
In blue we can see all the counties in the US where more than 30% of the population is over the age of 65. In orange are the counties where more 55% of the population is under the age of 35.

Like this map and want to support Landgeist? The best way to support Landgeist, is by sharing this map. When you share this map, make sure that you credit Landgeist and link to the source article. If you share it on Instagram, just tag @Land_geist. On X / Twitter tag @Landgeist.
Not surprisingly, we see a lot of orange coloured counties that have a college or university town. This explains why there are so many people under the age of 35 living in some of these counties.
What also isn’t too surprising, is the large number of blue coloured counties in Florida. Florida is know to be a popular place for people to retire.
An interesting fact is also the total population size of each county that is displayed. Of all the orange coloured counties displayed, 49% of them have a population over 50,000. However, of the counties in blue, only 14% of them have a population over 50,000. This most likely indicates, that a lot of the counties with more than 30% of it’s population aged over 65 are rural areas.
The population data is from 2019 and is gathered from census.gov.


Leave a comment