
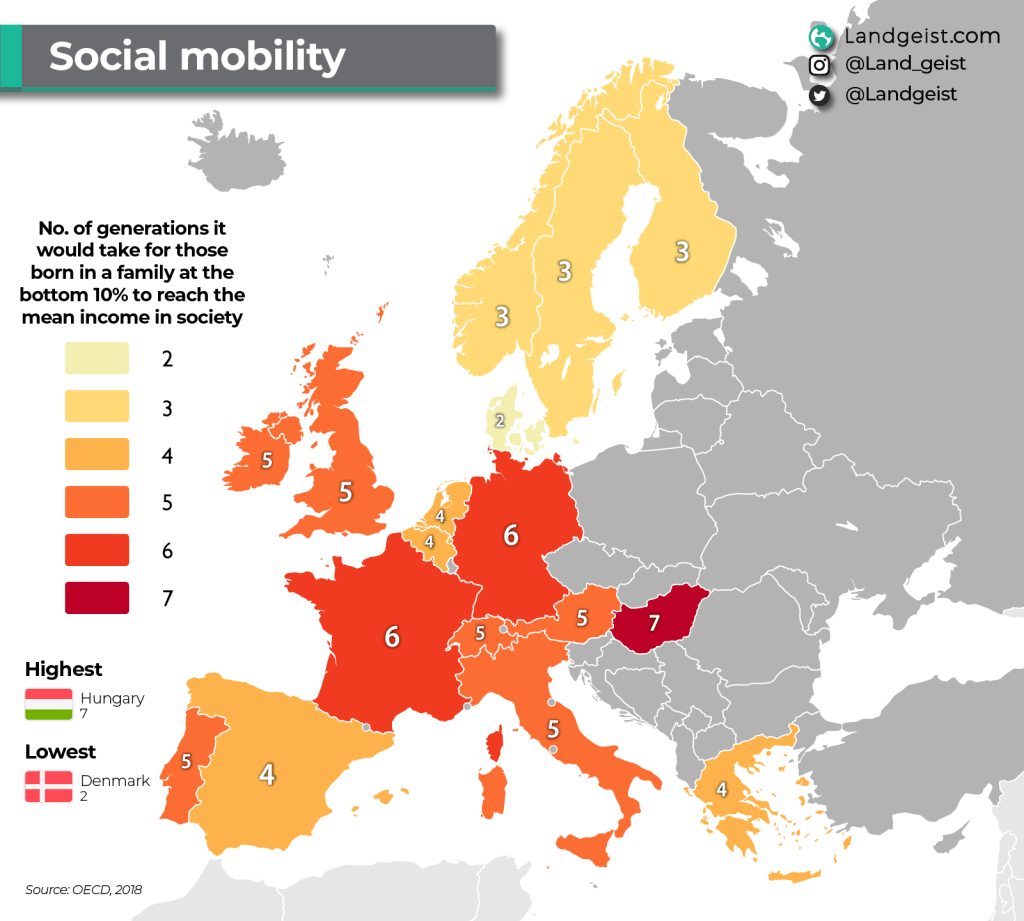
How many generations does it take to go from the bottom 10% to the country’s mean income?

Like this map and want to support Landgeist? The best way to support Landgeist, is by sharing this map. When you share this map, make sure that you credit Landgeist and link to the source article. If you share it on Instagram, just tag @Land_geist. On X / Twitter tag @Landgeist.
This map looks at some data from the OECD’s report on social mobility. It shows us how many generations it would take for offspring born in a family at the bottom 10% to reach the country’s mean income.
The Nordic countries have the best social mobility, with Denmark (2) having the lowest in Europe. In the Netherlands, Belgium, Greece and Spain, social mobility is also relatively good.
France, Germany (6) and Hungary (7) are the worst in Europe when it comes to social mobility. However, they are definitely not the worst from the OECD report. China and India do as poorly as Hungary (7). Brazil and South Africa do even worse, where it takes 9 generations. Colombia is at the bottom, where it takes 11 generations.


Leave a reply to Reading Lounge | Evocatively Ambiguous Cancel reply