
How much waste do European households generate per year?

Like this map and want to support Landgeist? The best way to support Landgeist, is by sharing this map. When you share this map, make sure that you credit Landgeist and link to the source article. If you share it on Instagram, just tag @Land_geist. On X / Twitter tag @Landgeist.
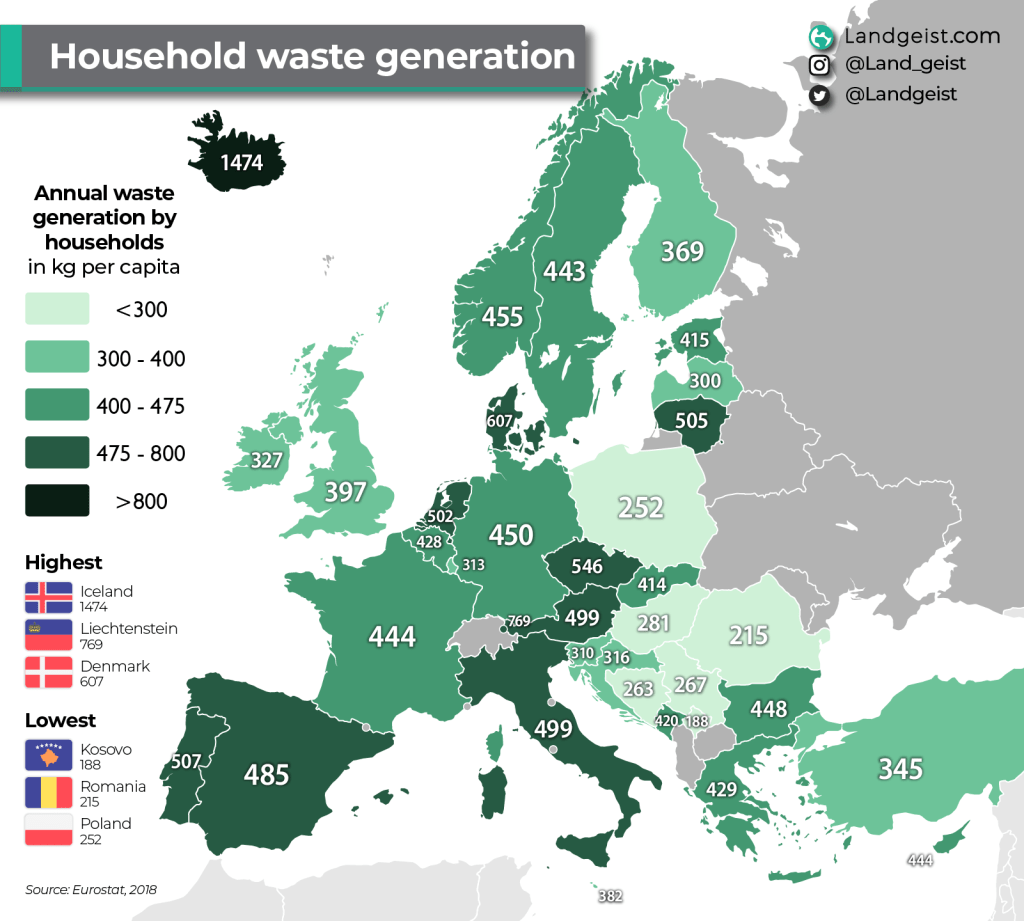
This map shows us the amount of waste each person generates every year based on the total household waste that is generated. This means that industrial waste and other waste generated by businesses, is not included in this statistic. Included in this number, is only the waste that is handed over to the waste collectors. Waste that you recycle and keep at your own house, which waste collectors don’t take, is not included. This data does not tell anything about how much of the waste is recycled after the waste collectors collect it.
The only geographical pattern we can see here, is that Eastern European countries generate a lot less waste. than the rest of Europe. Kosovo is at the bottom with 188 kg per capita per year, followed by Romania (215 kg) and Poland (252 kg).
The biggest generators of household waste are not concentrated in one part of Europe, but quite spread out. Three countries generate a lot more waste than any other European countries: Denmark (607 kg), Liechtenstein (769 kg) and Iceland (1,474 kg). For Liechtenstein, the tiny population might skew the data.
In an earlier version of this article, I mentioned that the waste in this Eurostat dataset consist of municipal waste, bulky waste, waste from markets and street-cleaning residues. These types of waste make up the largest part of the waste that households generate, but not all of it. It turns out I’ve mixed up household waste and waste generated by households. The types of waste I described earlier are household waste. The map shows ALL waste generated by households, which is exactly what I wanted to show. That means that the data on the map is still accurate, it’s just that what I wrote 2 days ago was wrong.
This also explains why Iceland’s number is so high. DIY is much more common in Iceland and therefore the waste from renovating or building a house (mineral, metal, wood, soil waste etc.) is higher in Iceland than other countries. In other countries, this waste would be counted as construction waste if a business does the renovation. For Iceland, major mineral wastes accounts for 665 kg. That’s a lot! However, even when we exclude the major mineral wastes, Icelandic households still produce the largest amount of waste in Europe. The Czech Republic is another country where major mineral wastes are high (92 kg). For other European countries, the major mineral wastes is relatively low.
So does that mean this map is wrong now too? No, it still shows all the waste that households generate, like the map says. It’s just that it includes far more types of waste than the description I initially used. This includes not just household waste, but also glass, cardboard, metal and waste from renovating your house. It’s fair to include those types of wastes in the data, as they are definitely types of waste that households create directly. It is debatable whether major mineral wastes should be included in the data, as it heavily skews the data for some countries. Not including major mineral wastes would significantly drop Iceland’s number ( from 1,474 kg to 809 kg), but it would still be the highest in Europe. The Czech Republic’s number would also drop significantly from 546 kg to 454 kg. For the other countries, not a whole lot would change and the top and bottom 3 of Europe would still be the same.


Leave a comment