
Where do Europeans prefer to go on holiday and what percentage of the population went on a holiday abroad in 2019?

Like this map and want to support Landgeist? The best way to support Landgeist, is by sharing this map. When you share this map, make sure that you credit Landgeist and link to the source article. If you share it on Instagram, just tag @Land_geist. On X / Twitter tag @Landgeist.
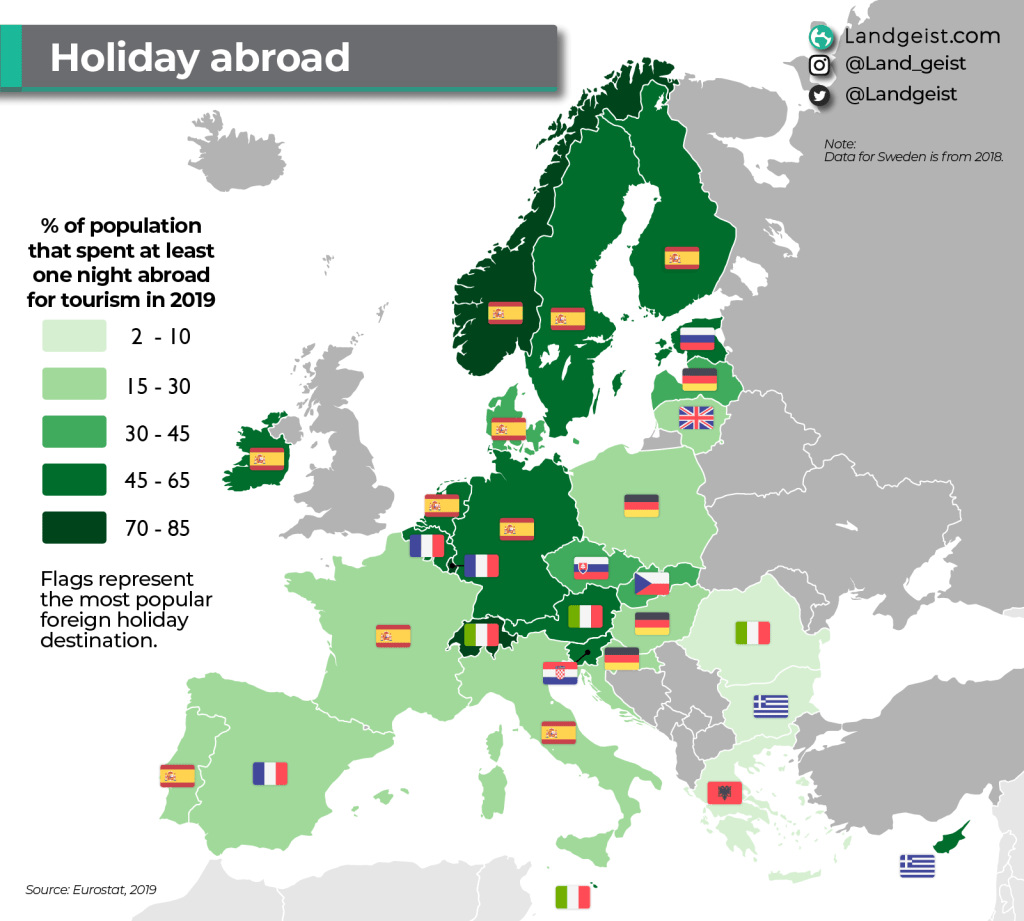
For most people, going on a holiday is one of the most exciting moments of the year. On this map we’re going to look where Europeans like to spend their holiday and what percentage of the population has travelled abroad for tourism in 2019.
It’s not difficult to spot what the most popular holiday destination is in Europe. The majority of the countries on this map prefer to spend their holiday in Spain. Other popular holiday destinations are Germany, Italy and France. We can also see two countries with a really interesting holiday destination. Czechs prefer to spend their holiday in Slovakia and Slovaks prefer to spend their holiday in Czechia.
Apart from the most popular foreign destination, this map also shows us what percentage of the population spent at least one night abroad for tourism. Romanians (2.5%), Greeks (7.6%) and Bulgarians (8.7%) have travelled the least abroad of the countries on this map. Even if we would take domestic holidays in to account, these three countries would end up at the bottom. 28.6% of Romanians went on a vacation (domestic or abroad) in 2019, 37.2% of Bulgarians and 40.8% of Greeks.
Luxembourg has the highest share of people that spent at least one night abroad in 2019. 82.5% of the population spent a night abroad. Switzerland comes in second, with 78.7% and Norway is third with 74.1%. If we look at any holiday (both domestic and abroad), Norway tops the rank, where 90.3% of people went on a vacation. Switzerland is second with 87.3% and the Netherlands third with 85%.
The data for this map is from 2019 and gives a good picture of the situation before the pandemic disrupted the tourism industry. The most popular holiday destination is based on the total number of nights people have spent in that country for tourism.
This map does not take into account the number of people that spend their holiday only in their own country. A low percentage of people spending their holiday abroad, doesn’t necessarily mean they don’t go on a holiday at all. On the other hand, a high percentage of people that spend their holiday abroad, doesn’t necessarily mean they also don’t go on a holiday in their own country.


Leave a comment