

‘Till death do us part’ is no longer the defining feature of the average marriage in some European countries.
Like this map and want to support Landgeist? The best way to support Landgeist, is by sharing this map. When you share this map, make sure that you credit Landgeist and link to the source article. If you share it on Instagram, just tag @Land_geist. On X / Twitter tag @Landgeist.
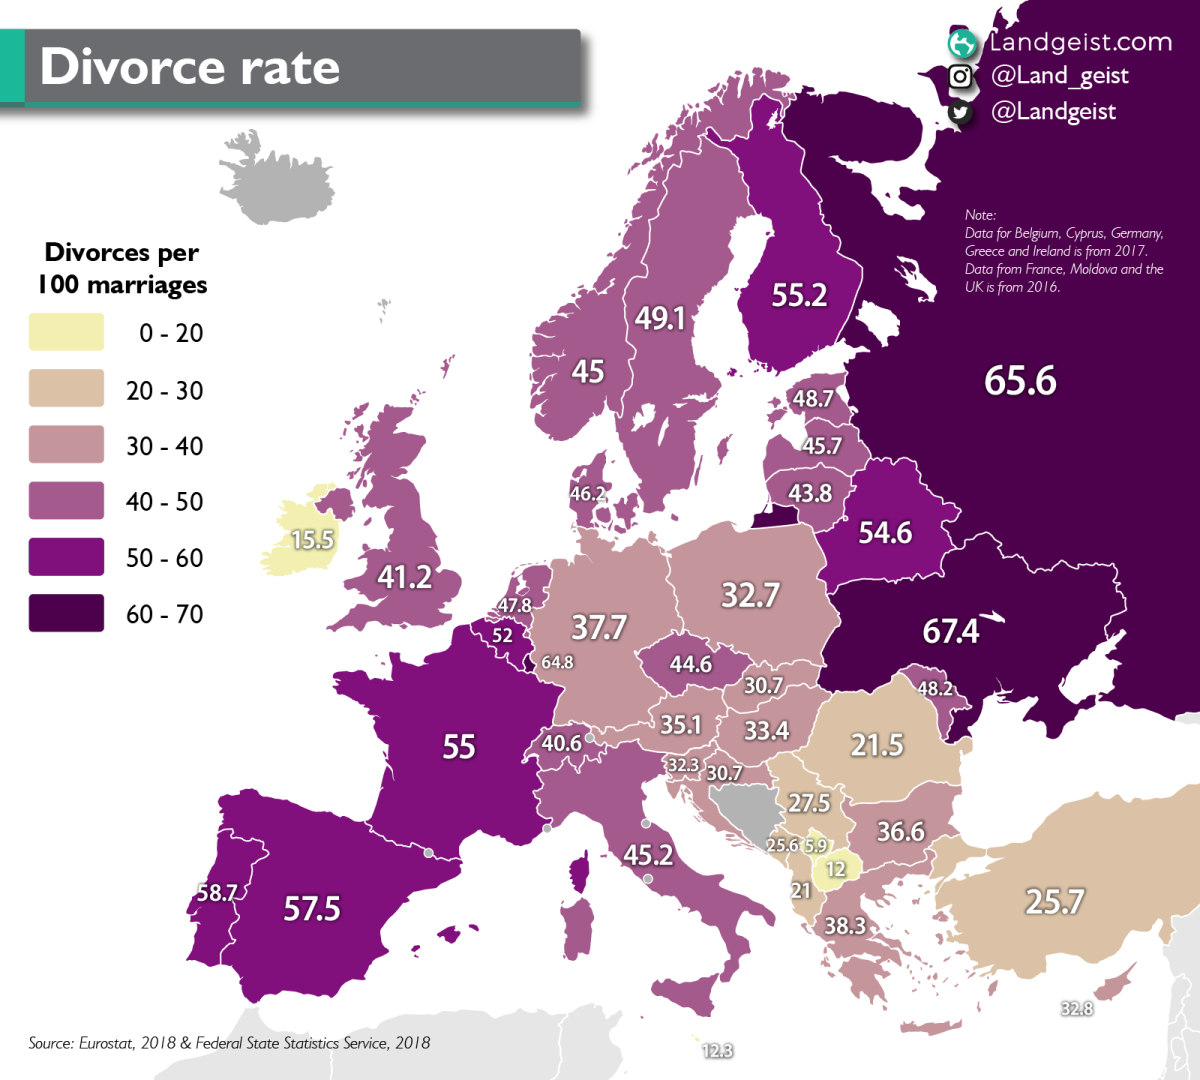
As we can see, the divorce rate varies a lot around Europe. In most countries it’s over 30%.
The divorce rate is the lowest in Kosovo (5.9%), North Macedonia (12%), Malta (12.3%) and Ireland (15.5%). One might suspect that how religious a country is, correlates with the divorce rate. You would certainly think that when looking at Ireland, a very catholic country. However, when we look at Poland, also a very catholic country, we can see a much higher divorce rate (32.7%). Poland’s divorce rate is similar to a lot of other countries that are much less religious.
The highest divorce rate can be found in Ukraine (67.4%), Russia (65.6%) and Luxembourg (64.8%).
The high divorce rate in Russia and Ukraine is believed to be because people there get married much younger. Irresponsibility and thoughtlessness are believed to be the reasons Russians and Ukrainians get married so young and eventually divorce. Other experts believe that financial problems are a big cause for the high divorce rate. However, another likely cause is spousal alcohol addiction. Which seem to be the main cause of 40% of break-ups in Russia according to this poll.
The data for this map comes from Eurostat. The Russian data from their Federal State Statistics Service.
The number of divorces per 100 marriages doesn’t specifically say how many marriages end in divorce. The couples that get married in that specific year are not the same as the ones that get divorced in that year. It is however very difficult to obtain statistics on the number of marriages from a specific year (let’s say 2001) that have ended in a divorce. Such statistics do not exist for most countries. On top of that, a marriage can always result in divorce in the future. Some couples divorce after 1 year, some after 20 years or not at all.
Measuring the divorces per 1,000 adults, also isn’t completely accurate. The percentage of adults that actually get married, varies per country. This could make it look like a lot of people get divorced in countries that also have a high marriage rate. And in a country with an extremely low marriage rate, it would have a very low divorce rate, even if most marriages would end in a divorce.
One could say that a declining number of marriages in most countries causes the divorce rate (per 100 marriages) to rise. But this is not true. In most European countries, the crude marriage rate and the crude divorce rate are following a similar pattern over the past 10-15 years. Both seem to be slowly declining. Which obviously isn’t too surprising. A lower number of marriages also means a lower number of divorces.
Despite its flaws, this metric is still one of the most accurate one out there. When calculating the divorce rate, the number of divorces per 100 marriages is still one of the most commonly used methods. Especially when you consider that the crude marriage rate and crude divorce rate follow a similar trend in most countries. It definitely isn’t a 100% accurate, but it is accurate in giving a good view at the differences in divorce rates per country.


Leave a comment