
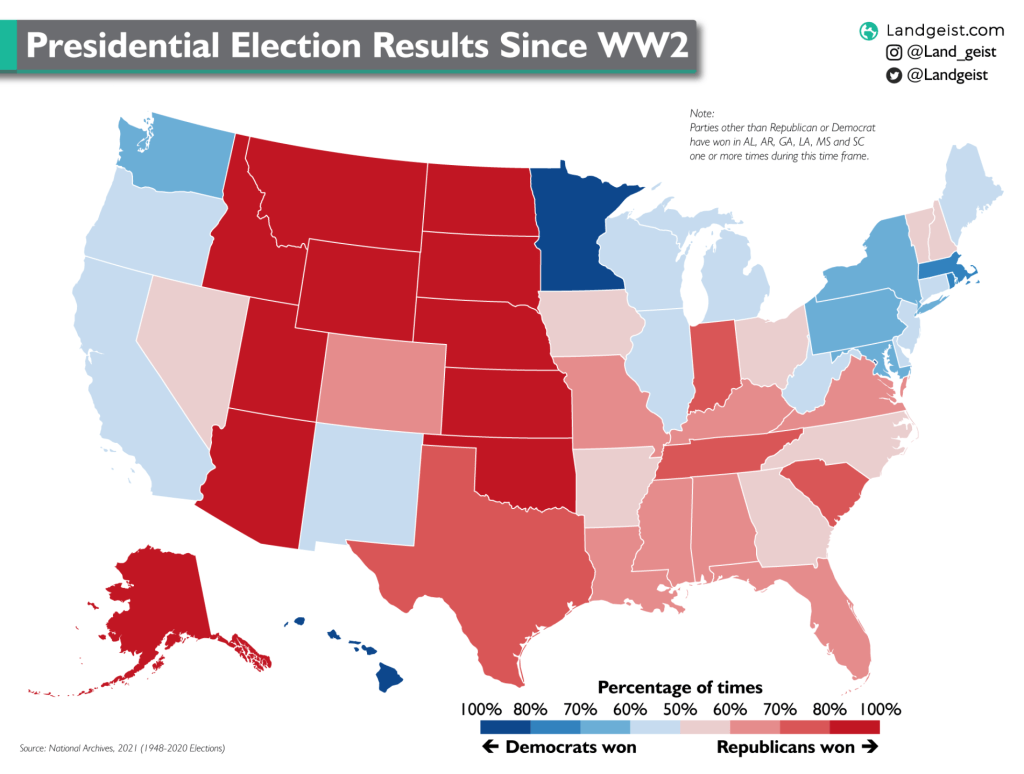
This map shows the percentage of times Democrats or Republicans have won the US presidential election per state. It covers the presidential elections from 1948 until 2020.

Like this map and want to support Landgeist? The best way to support Landgeist, is by sharing this map. When you share this map, make sure that you credit Landgeist and link to the source article. If you share it on Instagram, just tag @Land_geist. On X / Twitter tag @Landgeist.
At first glance, this map doesn’t look too surprising. The states in the Great Plains and the south are mostly red and the states in the north east and the west coast are mostly blue.
When we have a closer look, we do see some surprising results. The states in the Deep South, appear to be a lot less red than expected. This is mostly due to the fact that parties other than the Republicans or Democrats have won in the past in these states. In Alabama, Arkansas, Georgia, Mississippi and South Carolina, other parties than Republican or Democrat have won the presidential election there in the past: J. Strom Thurmond of the States’ Rights Democratic Party in 1948 (AL, LA, MS & SC), Harry Byrd as an independent candidate in 1960 (AL & MS) and George Wallace of the American Independent Party in 1968 (AL, AR, GA, LA & MS).
There’s another state that we might think of as a red state, but isn’t as red as we’d might expect. Actually, it’s not even red on this map. I’m talking about West Virginia. Although the Democrats haven’t won West Virginia since 1996, it did vote mostly Democrat until then.
On the other side, we also have several states that nowadays we consider a blue state. However, they are not as blue on this map as we might expect. California being one of them. A state that hasn’t voted Republican since 1988. California did however vote Democrat only twice between 1948 and 1988.
We see something similar in Colorado, New Hampshire and Vermont. States that are still red on the map, but have voted mostly Democrat in the past 3 decades. The same goes for blue states like Connecticut, Delaware, Illinois, Maine and Oregon. States that have voted exclusively Democrat since 1992, but are not as blue as one would expect. All because these states largely Republican before then.
Alaska and Hawaii have only been able to vote in the presidential election since 1959, when they acquired statehood. D.C. has been able to take part in the presidential elections since 1961, when the 23rd amendment was added to the constitution.
So which state is the most Democrat and most Republican over the 1948-2020 period?
For the Democrats there is a very clear winner: D.C. The democrats have won every single presidential election in DC. Second highest is Hawaii (88%) and third is Minnesota (84%).
For the Republicans there is not one clear winner. There are 4 states that have voted Republican in 95% of the presidential elections from 1948 to 2020: Kansas, Nebraska, North Dakota and South Dakota. They have voted Republican in all but one presidential election since World War 2. Coincidentally, all of them voted Democrat during the same election. In 1964, these states voted for Democratic candidate Lyndon B. Johnson. Who went on to win the 1964 election.


Leave a comment